We are pleased to present the results from our 2016 crops. The results can be found in .pdf form via the links below.
Weather data for 2016 can be found below as well.
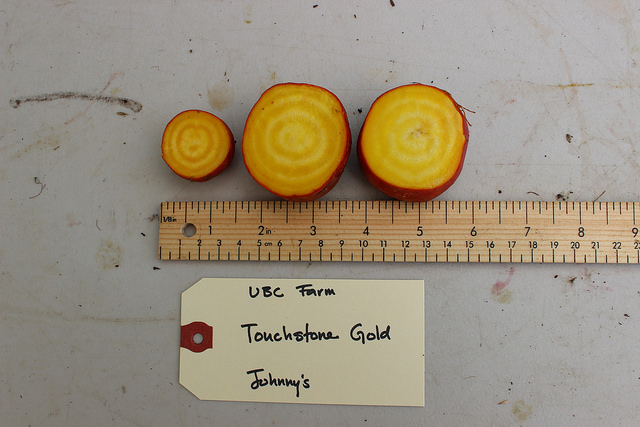 BC Seed Trials Beet Results 2016
Beets are a popular crop at BC farmers markets and golden beets are becoming more and more common. The southern coast of BC has a great climate for beet seed production.
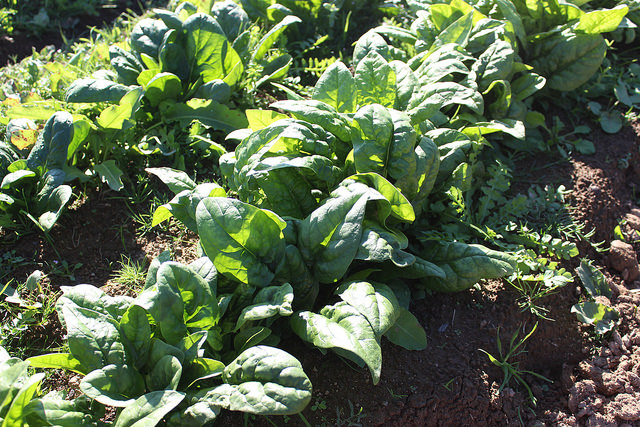 BC Seed Trials Spinach Results 2016
Spinach is another popular spring and fall crop at BC farmers’ markets. It is also a great seed crop for the region with much commercial spinach seed production happening just south of us in Washington State.
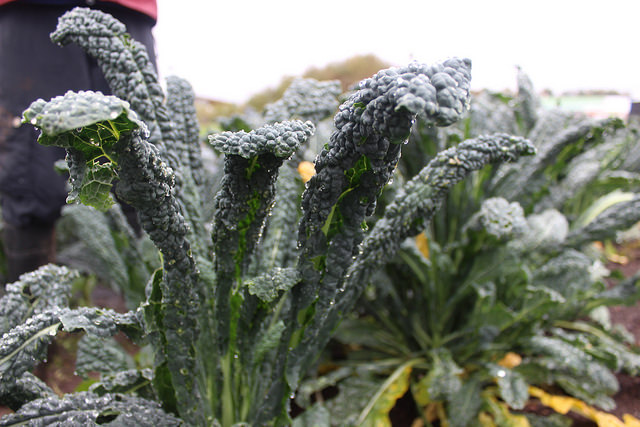 BC Seed Trials Kale Results 2016
Kale is a staple crop for most small farms in BC and is popular for its year-round production. The Lacinato style kales are very popular and we will be assessing them for many traits including overwintering.
 Seed Quality Assessment Project
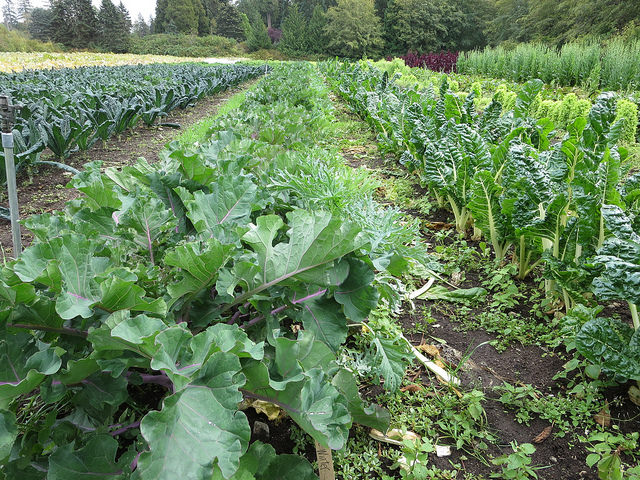
In 2016, the BC Eco Seed Co-op in collaboration with the UBC Farm Seed Hub and FarmFolk/CityFolk initiated a pilot project at UBC Farm to develop a model of practical on-farm trials to test seed quality. The intention was to explore various ways to conduct variety trials on a working farm without overwhelming farmers with data collection. These variety trials are meant to support the quality assurance program needed to offer quality seeds at a small/medium seed production scale.
Weather Data
| 2016 was the hottest year on record globally, yet was Canada’s coolest in 18 years – though still warmer than normal. Hot dry temperatures in May did have an impact on germination for several growers’ beet crops. Average daily precipitation was higher than usual as well – an unexpected change from 2015 which experienced significant precipitation deficits. | |||||||||||||
| All data below from Environment Canada | |||||||||||||
| Abbotsford A | |||||||||||||
| Fraser Valley | |||||||||||||
| Latitude: 49.03 | |||||||||||||
| Longitude: -122.36 | |||||||||||||
| 2016 | Jan | Feb | Mar | Apr | May | Jun | Jul | Aug | Sep | Oct | Nov | Dec | |
| Average Daily Max Temp. (degrees C) | 6.9 | 11.1 | 13.0 | 17.9 | 20.2 | 21.5 | 23.7 | 26.1 | 20.6 | 14.6 | 11.4 | 2.5 | |
| Average Daily Min Temp. (degrees C) | 0.8 | 4.1 | 5.0 | 7.8 | 9.4 | 11.4 | 13.4 | 13.1 | 9.8 | 7.9 | 6.4 | -2.7 | |
| Average Daily Precipitation (mm) | 5.6 | 6.7 | 5.4 | 2.4 | 1.9 | 1.7 | 1.0 | 0.5 | 2.3 | 8.8 | 10.8 | 4.7 | |
| 1981 – 2010 Trends | Jan | Feb | Mar | Apr | May | Jun | Jul | Aug | Sep | Oct | Nov | Dec | |
| Daily Maximum (°C) | 6.7 | 9 | 11.6 | 14.7 | 18.1 | 20.8 | 24 | 24.4 | 21.3 | 15 | 9.3 | 5.9 | |
| Daily Minimum (°C) | 0.4 | 1.1 | 2.7 | 4.8 | 7.8 | 10.5 | 12.2 | 12 | 9.3 | 5.9 | 2.7 | -0.1 | |
| Difference in Max | 0.2 | 2.1 | 1.4 | 3.2 | 2.1 | 0.6 | -0.3 | 1.7 | -0.7 | -0.4 | 2.1 | -3.4 | |
| Difference in Min | 0.4 | 3.0 | 2.3 | 3.0 | 1.6 | 0.9 | 1.2 | 1.1 | 0.5 | 2.0 | 3.7 | -2.6 | |
| SAANICHTON CDA | |||||||||||||
| South Vancouver Island | |||||||||||||
| Latitude: 48.62 | |||||||||||||
| Longitude: -123.42 | |||||||||||||
| 2016 | Jan | Feb | Mar | Apr | May | Jun | Jul | Aug | Sep | Oct | Nov | Dec | |
| Average Daily Max Temp. (degrees C) | 7.8 | 10.2 | 11.9 | 16.5 | 19.1 | 20.4 | 22.5 | 23.5 | 18.8 | 13.5 | 11.4 | 5.0 | |
| Average Daily Min Temp. (degrees C) | 2.9 | 4.7 | 5.0 | 8.0 | 10.2 | 11.7 | 13.1 | 13.3 | 10.5 | 8.0 | 6.2 | 0.1 | |
| Average Daily Precipitation (mm) | 4.5 | 5.0 | 3.8 | 0.6 | 0.6 | 0.7 | 0.4 | 0.4 | 1.1 | 7.8 | 4.9 | 6.4 | |
| COMOX A | |||||||||||||
| Central Vancouver Island | |||||||||||||
| Latitude:49.72 | |||||||||||||
| Longitude:-124.9 | |||||||||||||
| 2016 | Jan | Feb | Mar | Apr | May | Jun | Jul | Aug | Sep | Oct | Nov | Dec | |
| Average Daily Max Temp. (degrees C) | 6.6 | 8.6 | 11.1 | 15.4 | 19.3 | 20.3 | 22.6 | 24.2 | 18.0 | 12.6 | 10.6 | 4.2 | |
| Average Daily Min Temp. (degrees C) | 1.7 | 2.9 | 4.4 | 7.7 | 9.7 | 12.3 | 14.4 | 14.2 | 10.3 | 7.5 | 6.3 | -1.1 | |
| Average Daily Precipitation (mm) | 6.6 | 5.8 | 8.0 | 0.7 | 1.4 | 2.0 | 0.3 | 0.8 | 1.8 | 11.5 | 13.1 | 3.0 | |